Training data for urban blight detection
Identify and annotate urban blight classes.
Ref Data labeling and annotation- annotation
- image classification
- urban blight
- street view imagery
- ML
- Chips-ahoy
Detecting Urban Blight is a project developed by Development Seed in collaboration with Child Poverty Action Lab (CPAL) to identify urban blight areas in Dallas for targeted interventions. Development Seed developed a machine learning model to detect urban blight, an indicator of violent crime. The Urban Blight Tracker is a web application to aid decision-making.
We collaborated on the project by generating the model training dataset that detects signs of urban blight. This involved processing street view imagery from Mapillary to annotate 16 urban blight classes, categorized on vacant lots, and structure issues.
Recognizing and defining the characteristics of blight in structures or lots, only observed through street view imagery, and accurately transferring that knowledge to the training data has been a challenge. We worked closely and in coordination with CPAL and the Development Seed's ML team to continuously improve the training data. This collaboration was crucial during the three main phases of the blight class annotation: (1) Understanding blight classes, (2) Processing street view imagery, and (3) Image annotation.
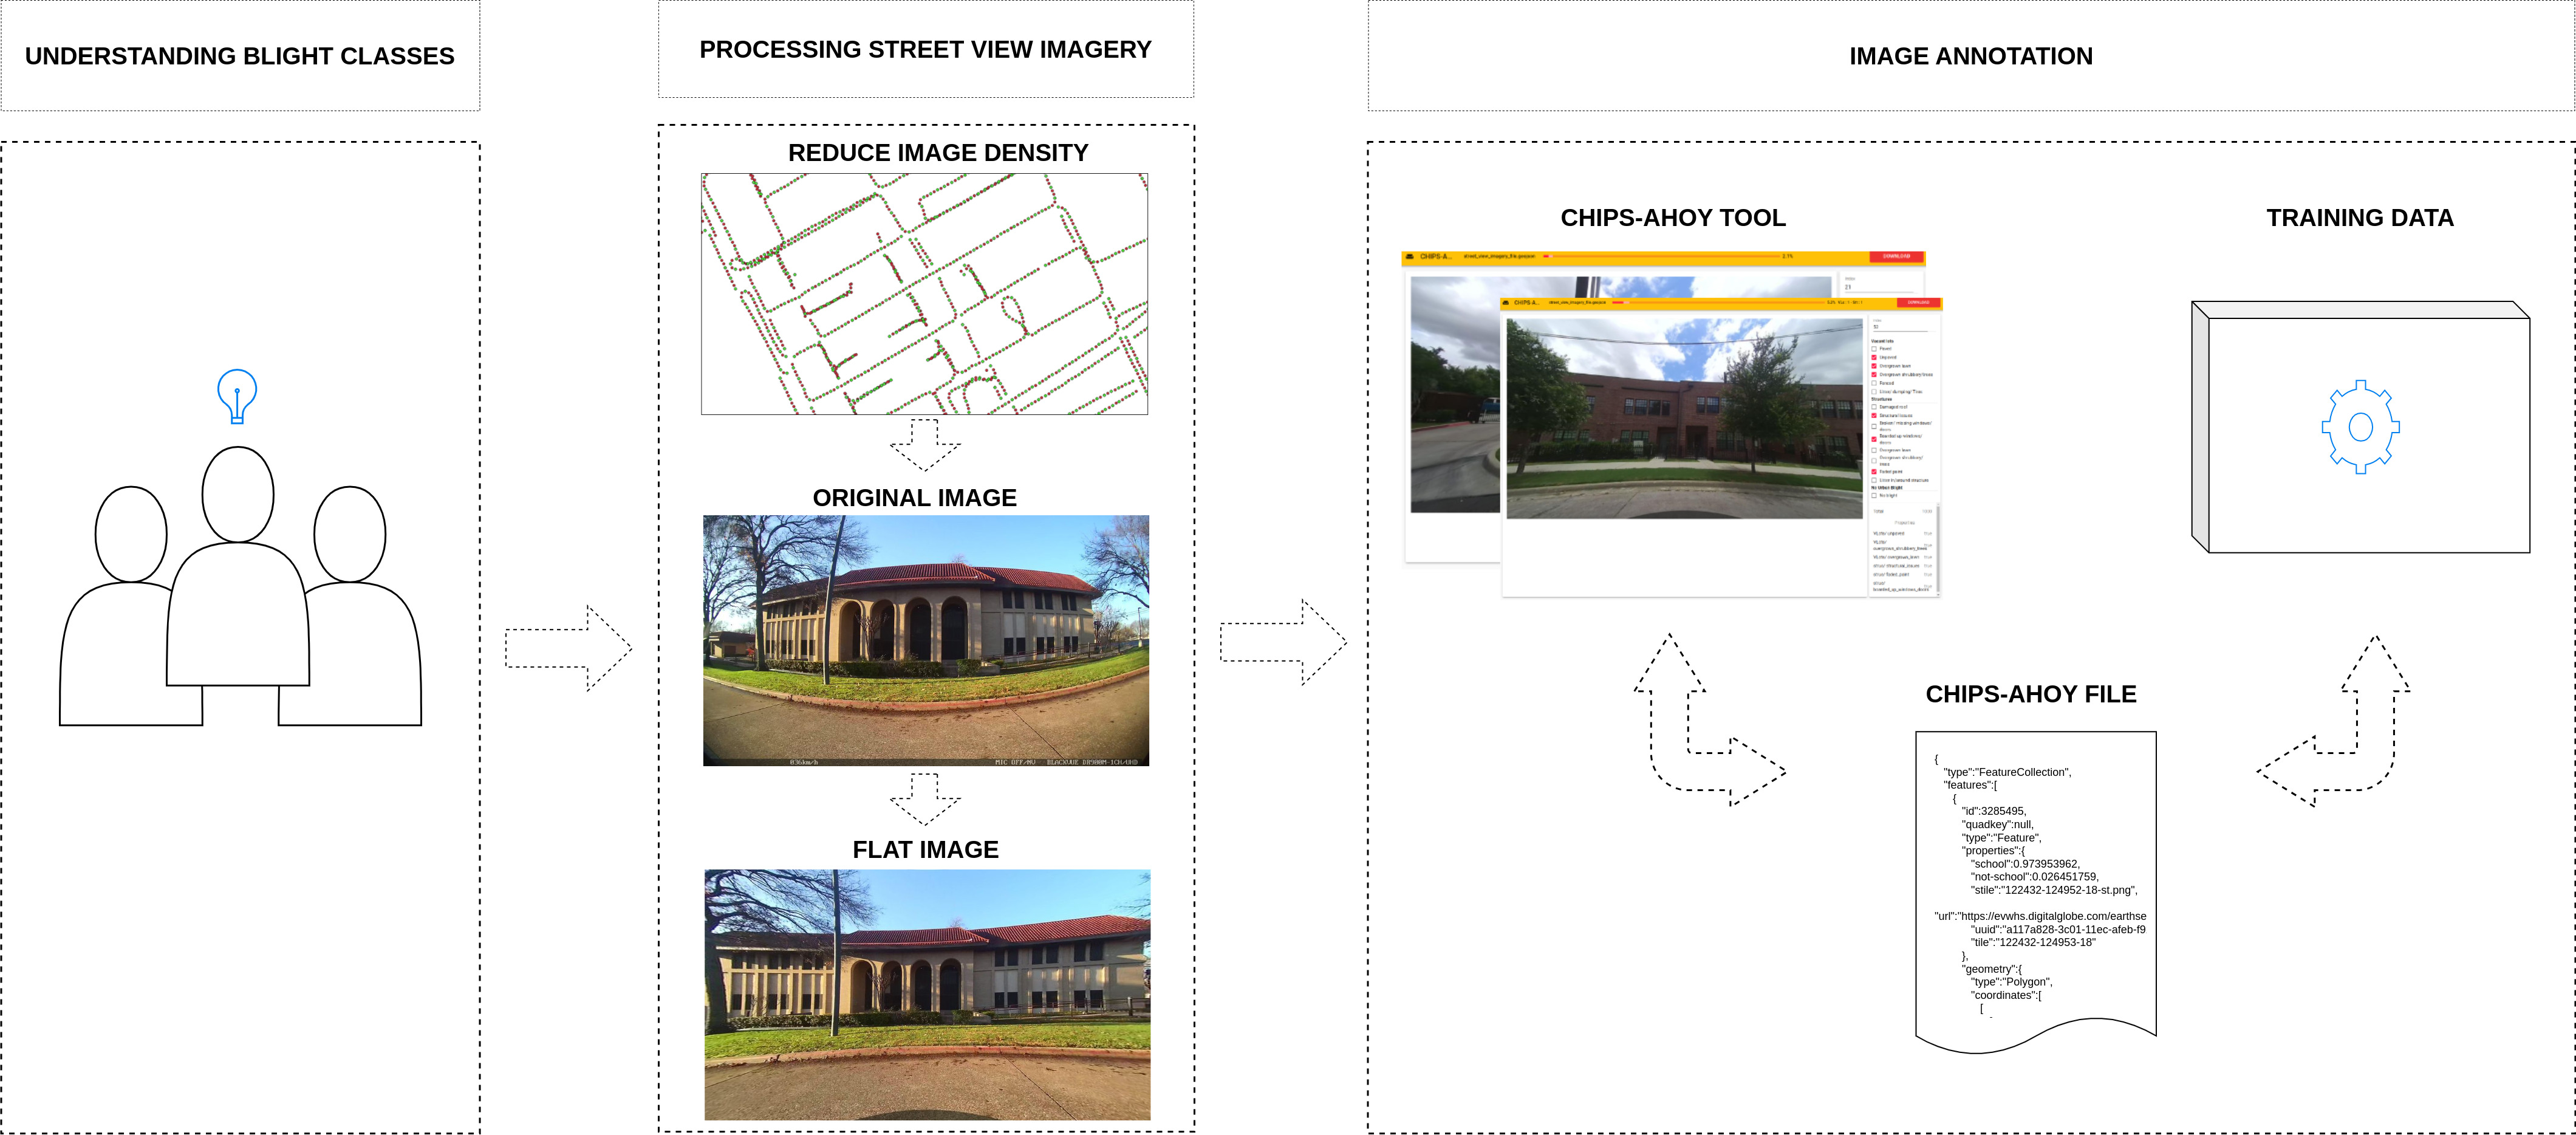 Training data creation process
1. Understanding blight classes
Since identifying and defining the characteristics of urban blight is a complex task that requires the participation of experts in the field, exploration, and communication played vital roles in obtaining a well-documented list of classes to annotate with their respective definitions and examples using street view imagery.
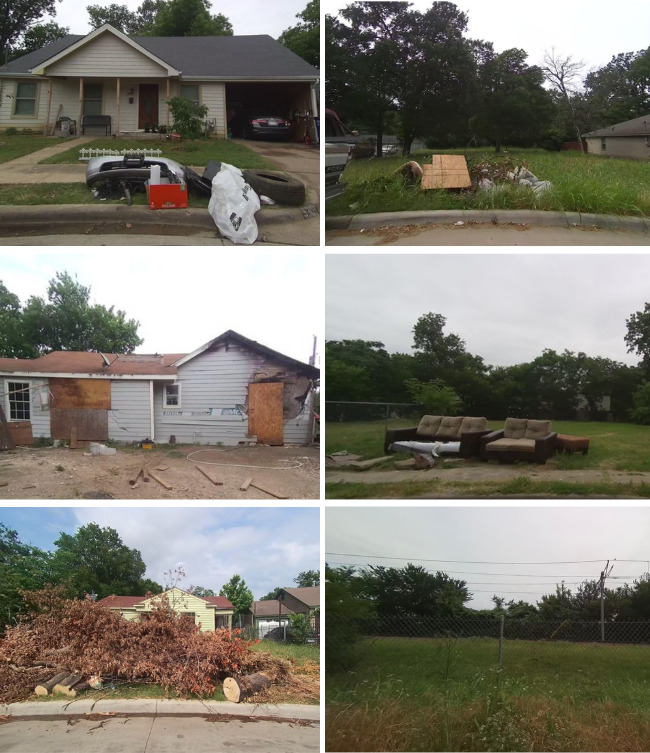
As a result of this phase of exploration and understanding, we defined two main categories and 16 classes for annotation. (1) Vacant lots: paved, unpaved, overgrown lawn, overgrown shrubbery/trees, fenced, litter garbage, litter dry brush; and (2) Structures: damaged roof, structural issues, broken/missing windows/doors, boarded up windows/doors, overgrown lawn, overgrown shrubbery/trees, faded paint, litter garbage, litter dry brush.
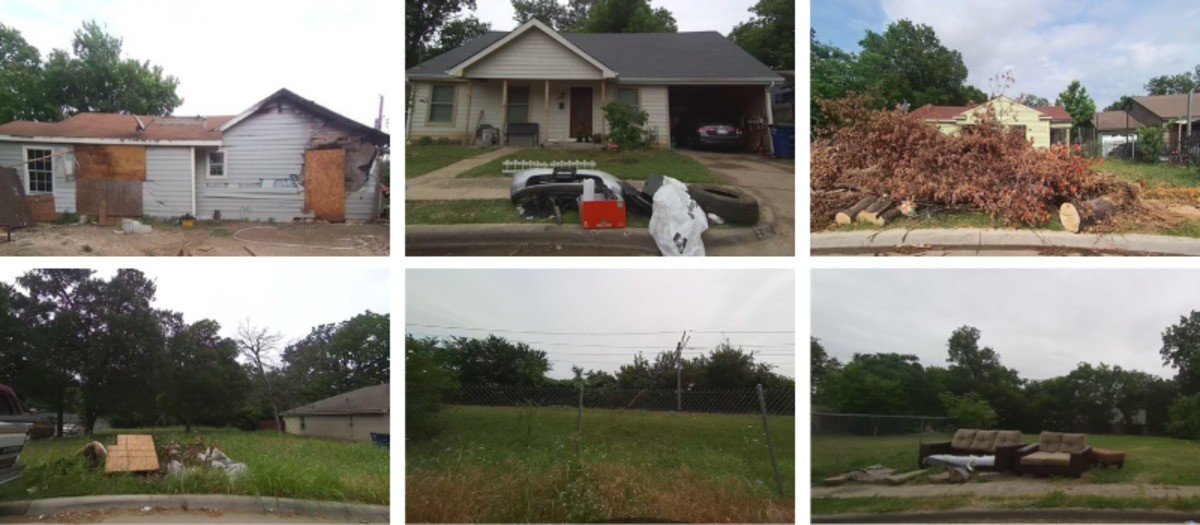 Blight examples in structures and lots
2. Processing street view imagery
Kaart collected Dallas data in May 2022, uploading over 180,000 images to Mapillary. We processed the images before using them to generate the training dataset.
We first reduced the image density to process the images since Mapillary has numerous image sequences for each street, pointing to the right, left, and straight ahead on the road. We developed a custom Java OpenStreetMap Editor (JOSM) plugin to identify and remove unnecessary sequences. In addition, we removed redundant and too-close images from the resulting sequences. A Python script was written to get the images for every 10 meters.
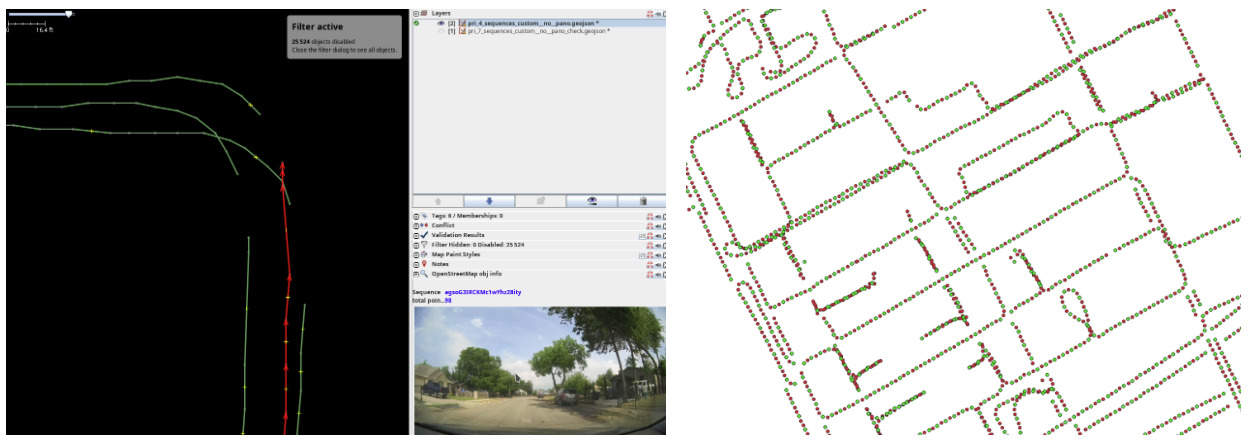 Removing unnecessary sequences (left) and reducing the density of the images (right)
Second, we developed scripts to process and correct lens distortion in flat images.
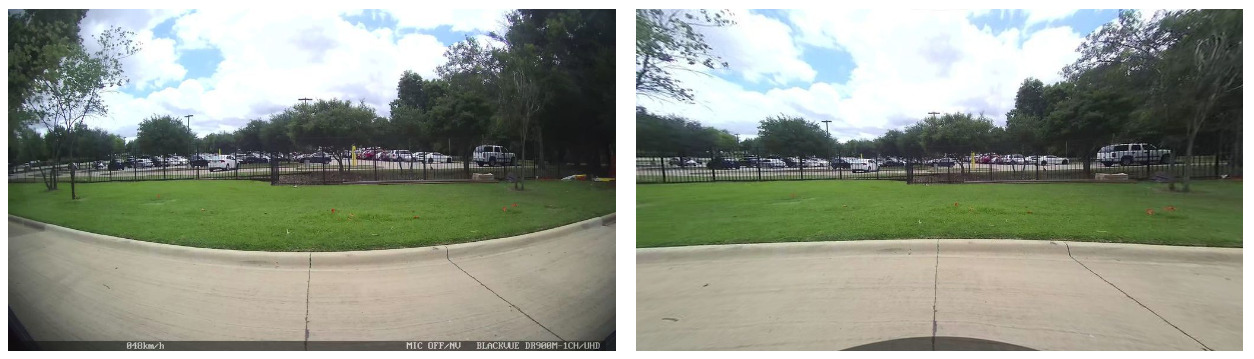 Original image (left), Flat image (right)
Finally, we filtered the left and right images to start with the data annotation process.
3. Image annotation
As a distributed team working across the entire city of Dallas, it was essential to establish a workflow that facilitated rapid iteration, remote collaboration, and continuous feedback. We stored datasets on Amazon Simple Storage Service (S3), ensuring they were accessible to everyone at all times.
We divided the work by creating tasks for small areas, each consisting of 1,000 image blocks, which allowed us to distribute the workload among all annotators. Once we annotated all the tasks in the area, we used the scripts we wrote to compile, validate, and generate statistics by area. These statistics were valuable for tracking the total number of images annotated per class, enabling us to focus on classes with fewer annotated images to improve coverage. This approach ensured that the ML model had sufficient examples per class for accurate results.
In total, we annotated over 7,500 images with blight examples, each containing one or more blight labels, and more than 2,900 images with non-blighted classes.
Chips-ahoy, one of our custom-developed tools specialized in image classification, was really helpful in classifying images due to its versatility, simplicity, and speed. It enabled us to review and annotate thousands of images effectively.
- Versatility: Chips-ahoy allowed engineers to quickly adapt to new categories and subcategories with minimal code adjustments. It also supported creating an output format tailored to the needs of ML engineers, ensuring compatibility with the validation process.
- Simplicity: The tool’s user-friendly design enabled us to focus on annotation, as many functions were streamlined with shortcuts and clicks, reducing complexity.
- Speed: Chips-ahoy's architecture optimized performance by downloading images in the background and caching them before and after annotation. This approach enhanced both performance and user experience.
 Image classification example using Chips-ahoy tool